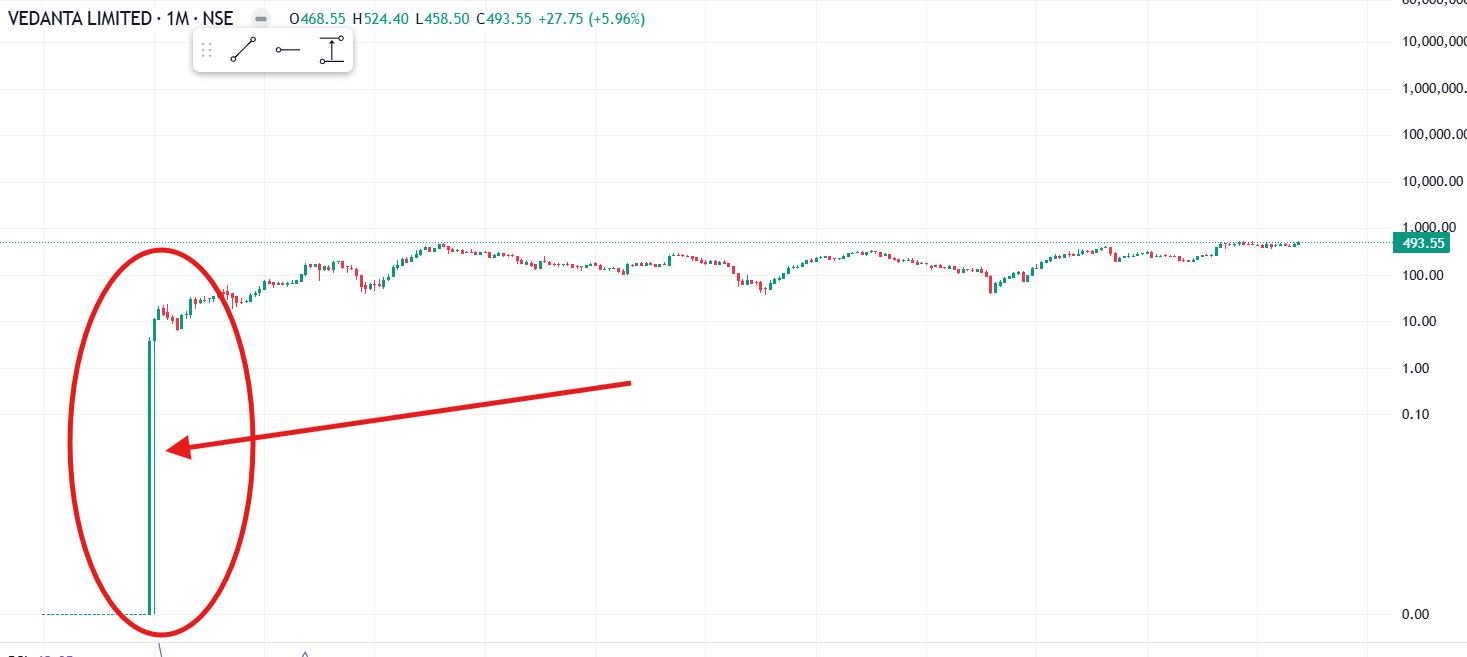
There seems to be some glitch with Vedanta life charts input value. It is showing such a weird chart in a monthly time frame.

Where as same chart in trading view looks completely different.
This all are minor glitches, but cant be ignored, when doing analysis for long term prediction.
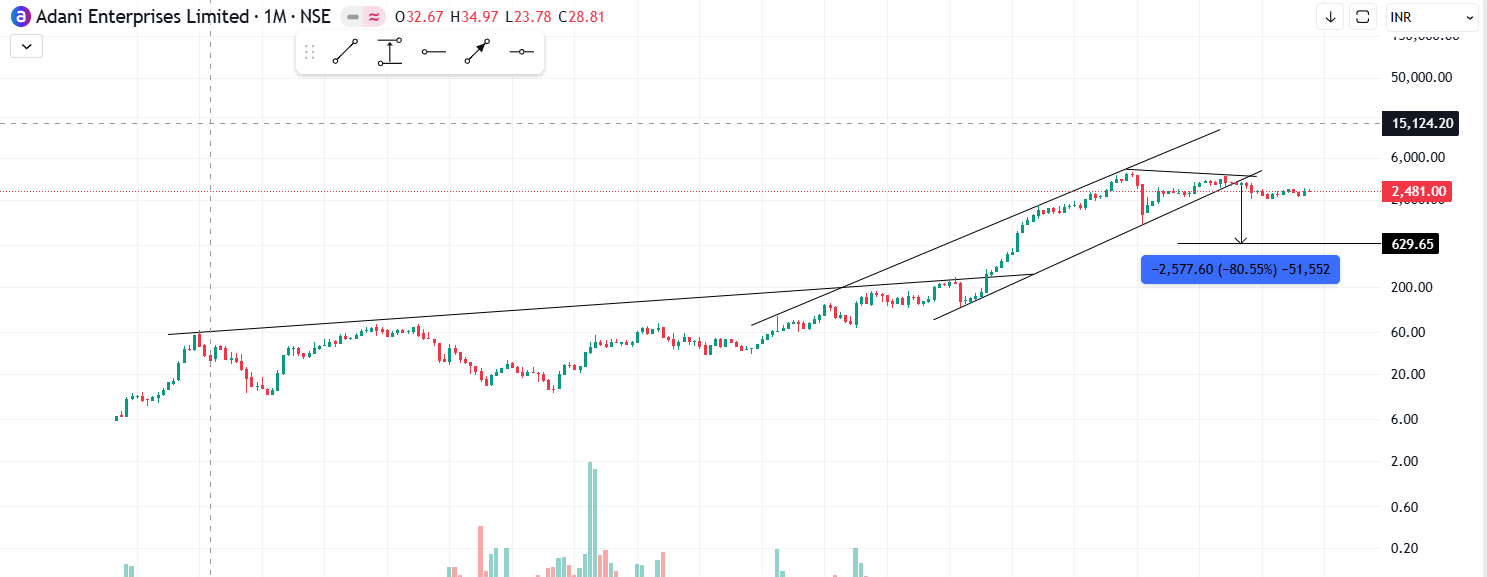
Adani enterprise chart in upstox.tv looks completely different from chart in trading view. Jst wondering how does same platform shows different chart