Understanding Chart Patterns from Scratch
What Are Chart Patterns
Chart patterns are structures formed by price movement on a chart over time. They emerge because market participants react similarly at certain price levels. Fear, greed, profit booking and accumulation repeat again and again, and this repetition creates patterns.
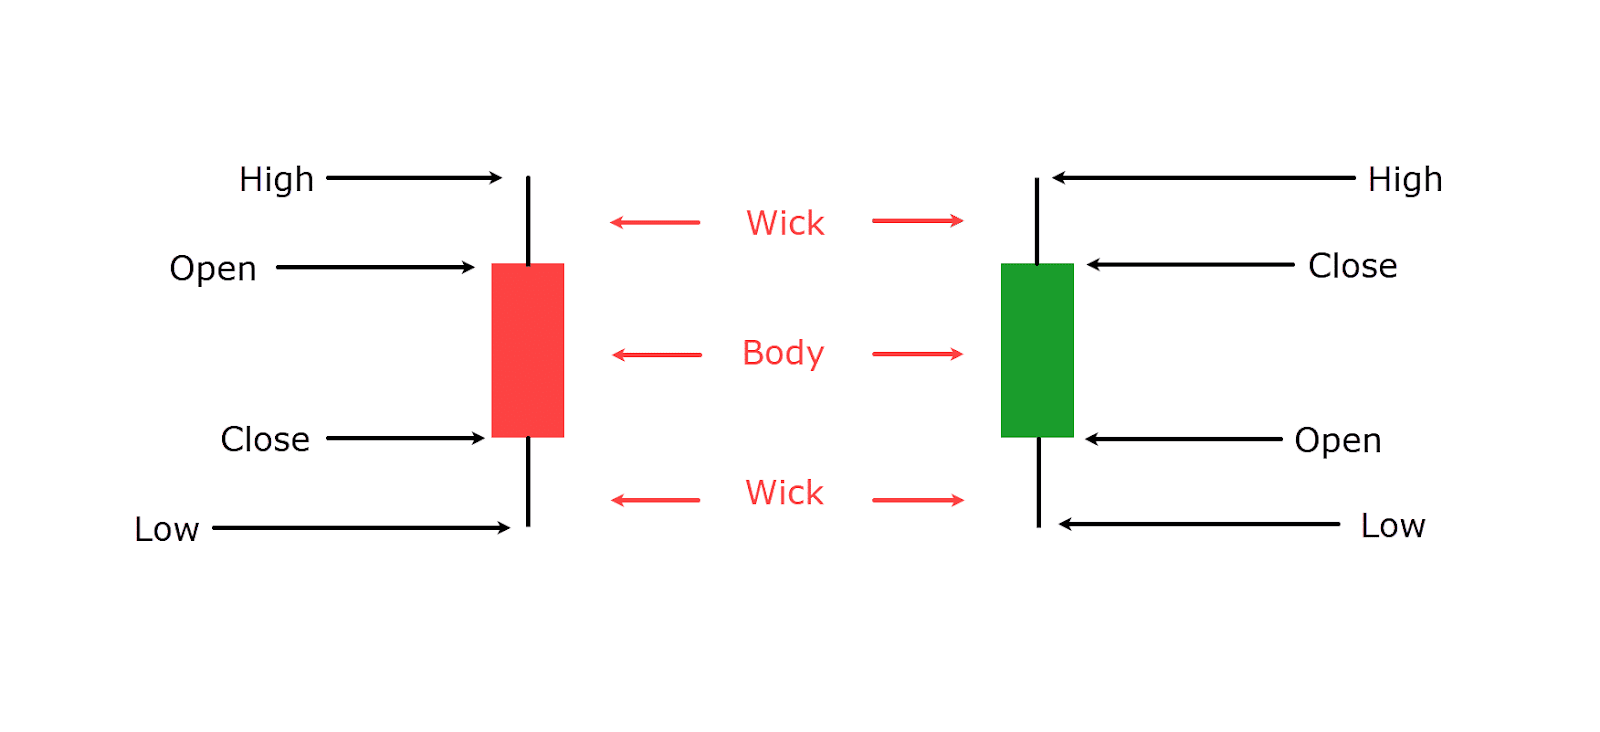
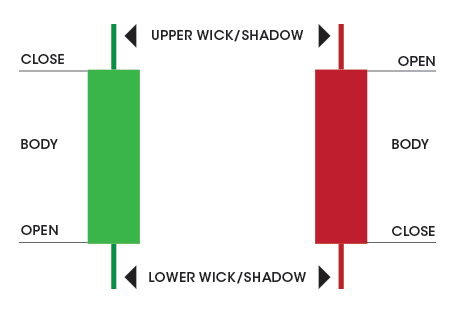
Chart patterns are built using OHLC candles:
-
Open: where price started
-
High: highest traded price
-
Low: lowest traded price
-
Close: where price ended
Important rule
Patterns are confirmed by candle closes, not by wicks alone.
Time Frames and Reliability
-
Lower time frames (1 to 5 min): faster, more noise
-
Medium time frames (15 to 30 min): best for intraday
-
Higher time frames (daily, weekly): fewer but more reliable patterns
Higher time frame patterns dominate lower time frame patterns.
Level 2: Intermediate
Reversal and Continuation Patterns Explained
Head and Shoulders Pattern
Reversal Pattern

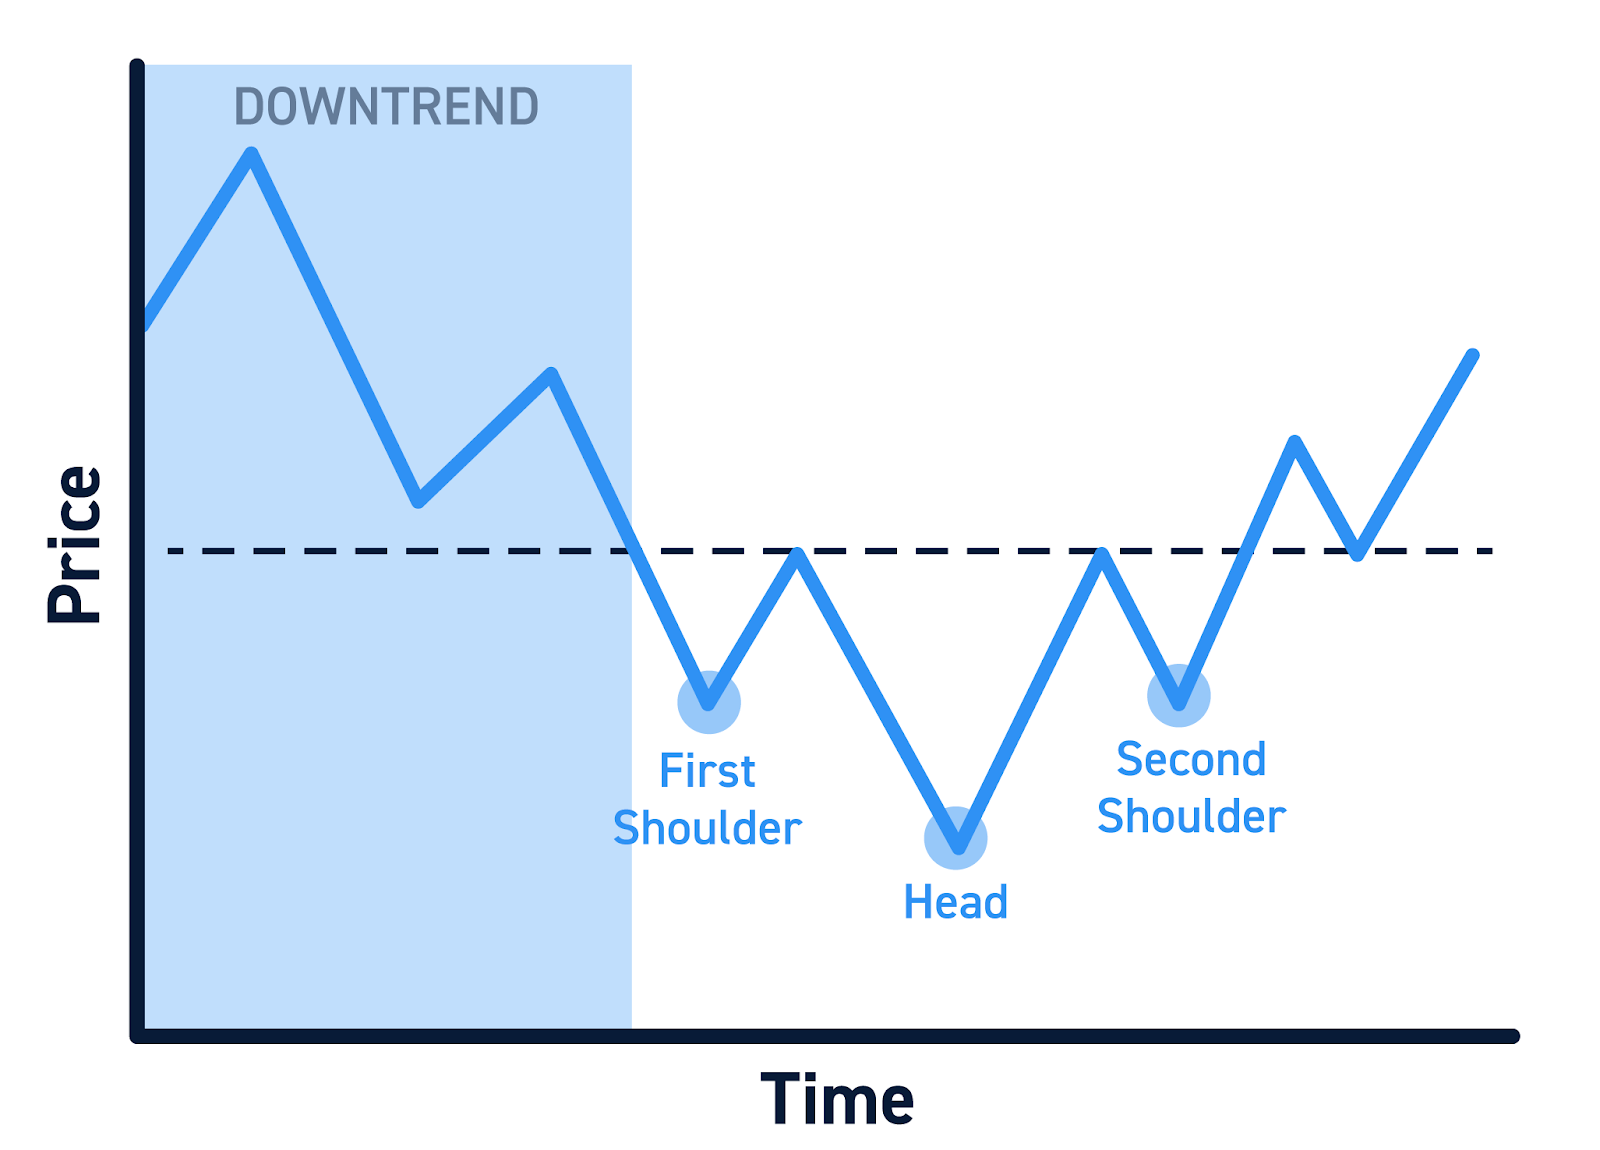
Structure
-
Left shoulder: price makes a high and pulls back
-
Head: price makes a higher high and pulls back
-
Right shoulder: price makes a lower high
-
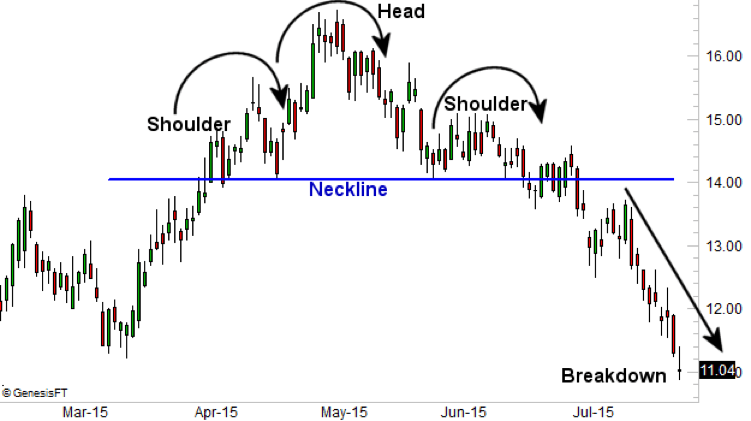
Neckline: connects the two pullback lows
OHLC Confirmation
A strong candle close below the neckline confirms the reversal.
Real Example (Structure-Based)
Instrument: NIFTY
Time frame: 15 minute
-
NIFTY rallies from 21,900 to 22,200
-
Left shoulder forms near 22,150
-
Head forms near 22,240
-
Right shoulder forms near 22,160
-
Neckline around 22,050
A 15-minute candle closes below 22,050.
This confirms trend reversal.
Trade Plan
-
Entry: Below neckline close
-
Stop loss: Above right shoulder
-
Target: Distance from head to neckline projected downward
Double Top and Double Bottom
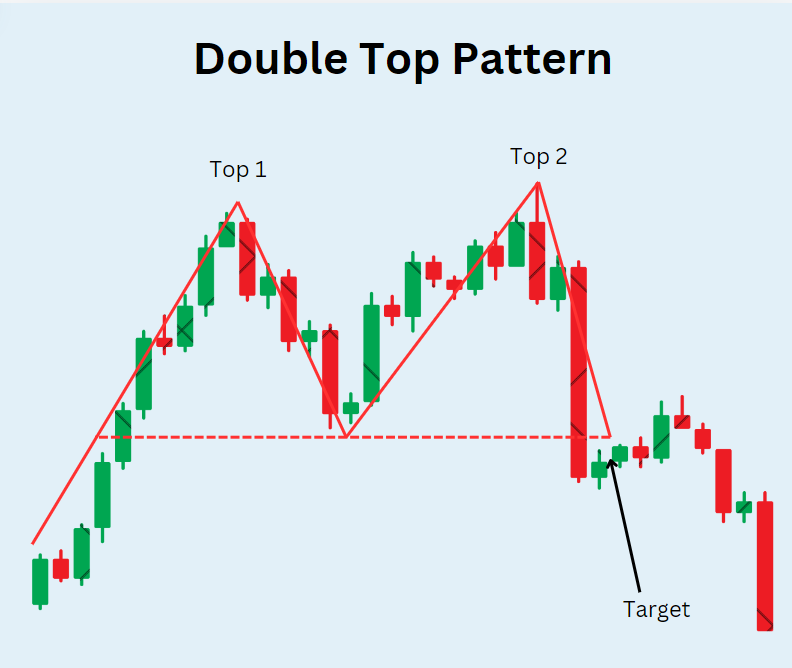

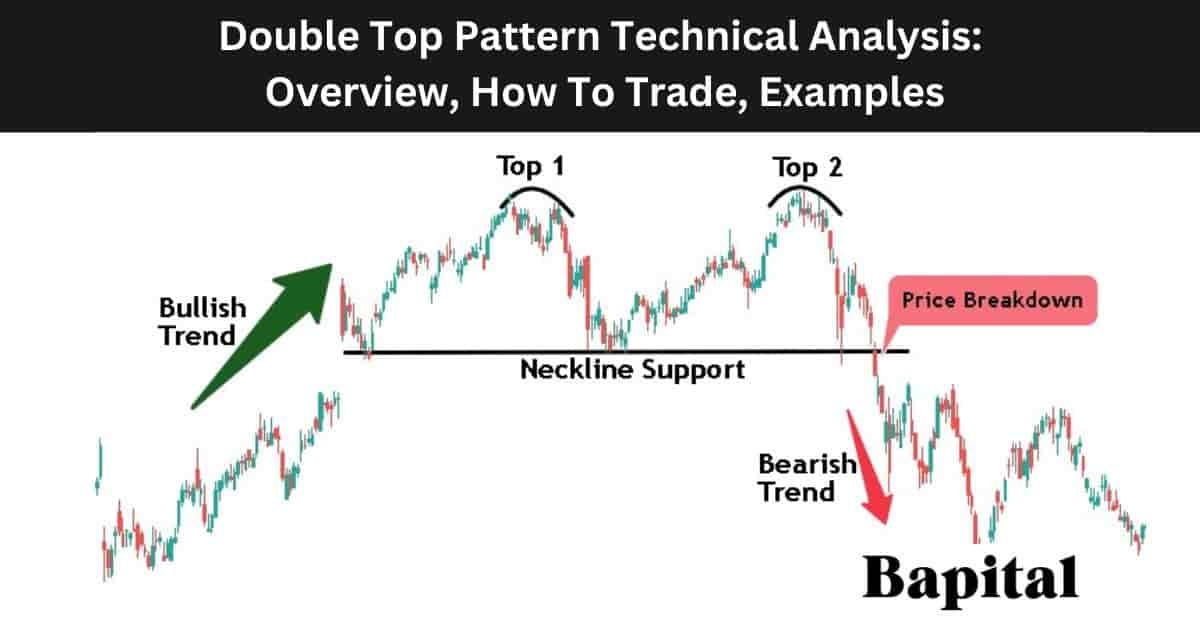
Double Top
-
Appears after an uptrend
-
Price fails twice at same resistance
-
Breakdown below middle low confirms reversal
Double Bottom
-
Appears after a downtrend
-
Price holds support twice
-
Breakout above middle high confirms reversal
Key mistake
Entering before confirmation.
Flag and Pennant Patterns
Continuation Patterns
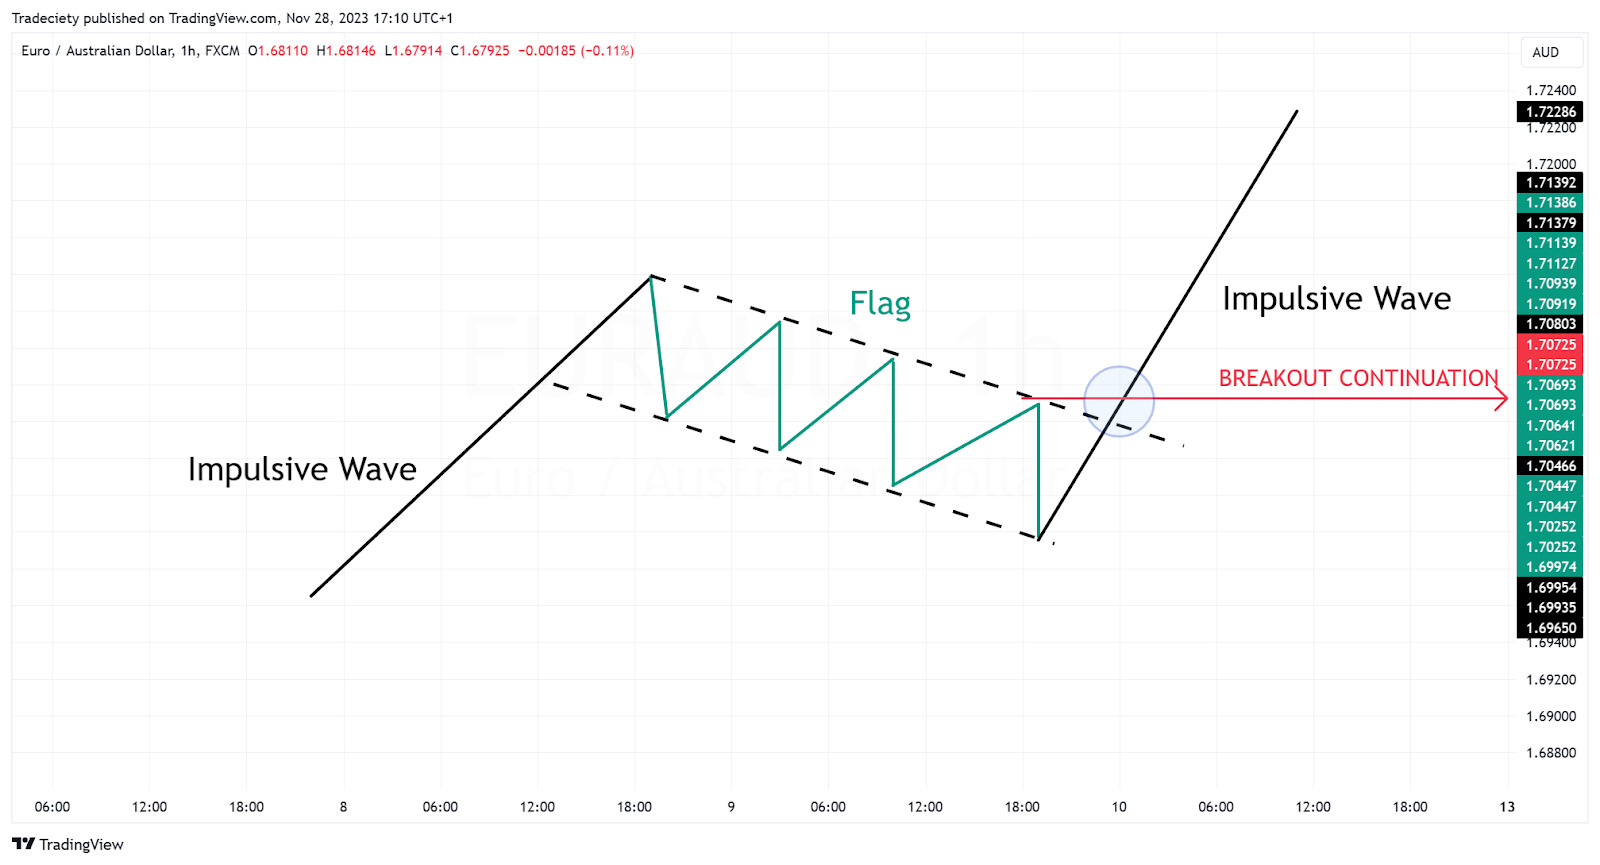
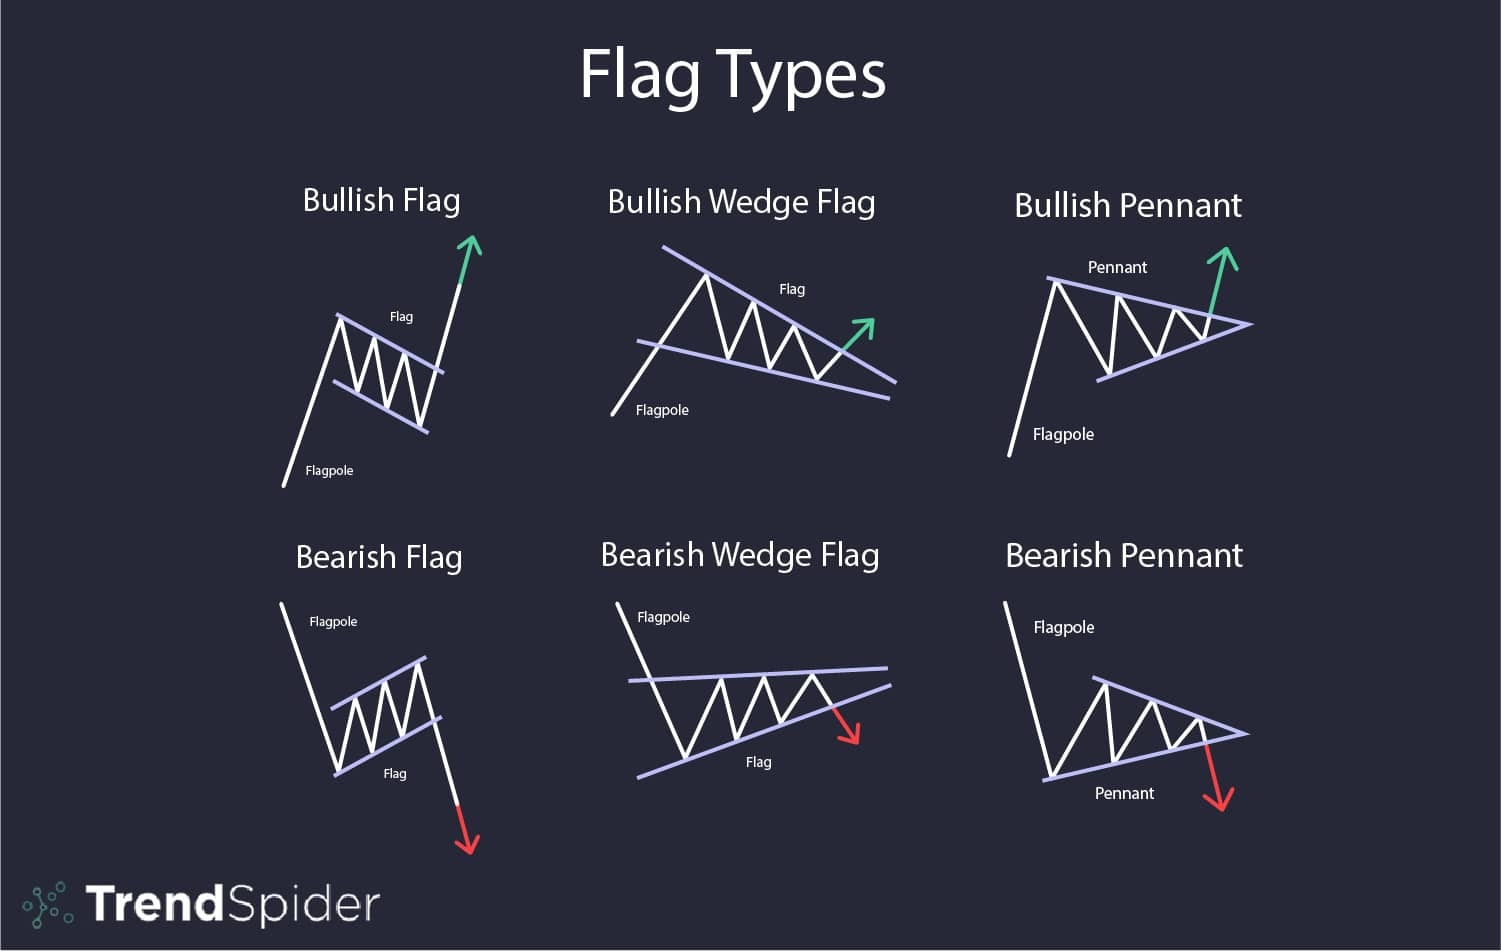
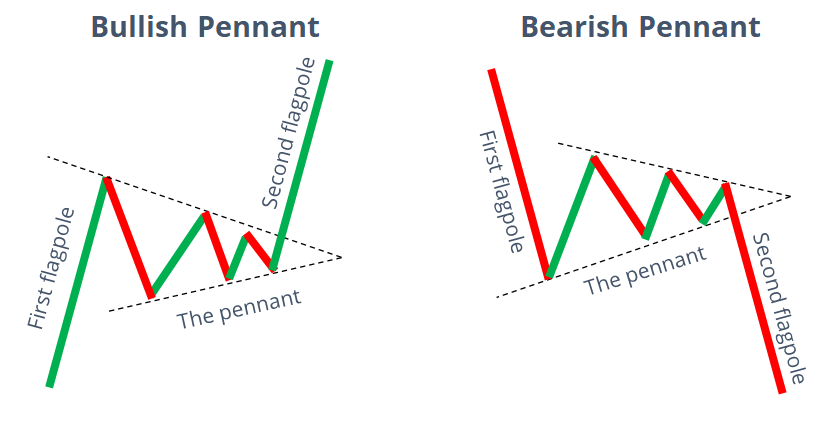
Flag Pattern Logic
-
Strong impulsive move (flagpole)
-
Short consolidation in opposite direction
-
Breakout continues trend
OHLC Behavior
-
Large candles during impulse
-
Small-bodied candles during consolidation
Real Example
Instrument: BANKNIFTY
Time frame: 5 minute
-
Price jumps 300 points in 20 minutes
-
Consolidates in a tight range for 6 candles
-
Breakout candle closes above flag
Trend continues.