Understanding FII & DII Activity: The Money Flows That Move the Market
It’s common to hear things like:
“FIIs were net sellers of ₹2,500 crore today” or
“DIIs bought ₹1,800 crore worth of stocks.”
But what does this really mean for the market? Why do these inflows and outflows matter so much? And how can traders and investors use this information to make smarter decisions?
Let’s decode the story behind FII and DII activity - from the basics to the deeper market impact.
Who Are FIIs and DIIs?
Before diving into the numbers, let’s first understand the basics.
Foreign Institutional Investors (FIIs)
- These are large global entities - such as mutual funds, hedge funds, and pension funds - that invest in Indian markets.
- Their decisions depend on global factors: interest rates in the US, dollar strength, crude oil prices, or geopolitical risks.
- FIIs bring in foreign capital, making them a major source of liquidity in the Indian market.
Domestic Institutional Investors (DIIs)
- These are Indian institutions like mutual funds, insurance companies, and banks investing within India.
- Their investments are often long-term and stable, reflecting domestic confidence.
- DIIs play a key role in absorbing volatility when FIIs pull money out.
How Money Flows Affect Market Direction
At a high level:
- When FIIs buy, foreign money flows into India → market sentiment turns positive → equity indices rise.
- When FIIs sell, money flows out → market sentiment weakens → indices often fall.
However, the real story is deeper than just “buy” or “sell”.
-
Impact on Equity Markets
- FIIs usually invest in large-cap stocks (Nifty 50, Sensex companies).
- Their large buy/sell volumes can move entire sectors: for example, heavy FII buying in banks can lift the entire Bank Nifty.
- DIIs often counterbalance this: when FIIs sell, DIIs step in to buy at lower prices, stabilizing the market.
Example:
If FIIs sell ₹3,000 crore worth of equities in a day, and DIIs buy ₹2,500 crore, the net outflow is ₹500 crore.
This might cause mild weakness - not a crash, because DII buying absorbs much of the selling pressure.
-
Impact on F&O (Futures & Options) Markets
- FIIs are active in index futures and stock derivatives.
- Their F&O positions often signal short-term sentiment - bullish or bearish.
- Example indicators:
- FII long positions increasing in index futures → bullish bias
- FII short build-up in index futures → bearish bias
-
Traders closely track FII net positions on the NSE’s derivative data page to gauge near-term market trends.
A Quick Data Snapshot (Example)
Let’s take a simplified example from a typical trading day:
| Segment | FIIs (₹ Cr) | DIIs (₹ Cr) | Net Impact | Market Reaction |
|---|---|---|---|---|
| Equity | -2,800 | +2,200 | Negative | Mildly negative |
| Index Futures | +1,200 | - | Positive | Nifty stable or slightly positive |
| Stock Futures | -800 | - | Negative | Mixed stock-specific reactions |
Here, even though FIIs sold equities, their long positions in index futures hint that they expect short-term stability: not a full-blown bearish phase.
The Economics Behind the Moves
-
Global Liquidity Drives FII Behavior:
- When global interest rates rise (e.g. in the US), FIIs often pull money out of emerging markets like India to chase safer returns abroad.
- When rates fall or global liquidity increases, FIIs bring money back - boosting Indian equities.
-
Domestic Confidence Fuels DII Buying
- DIIs often buy when valuations become attractive or when SIP (Systematic Investment Plan) inflows remain strong.
- Their steady buying provides a cushion against sharp market falls.
-
Currency Connection
- Large FII inflows strengthen the rupee, while outflows weaken it.
- This link between FII activity and currency stability adds another macroeconomic layer for traders to watch.
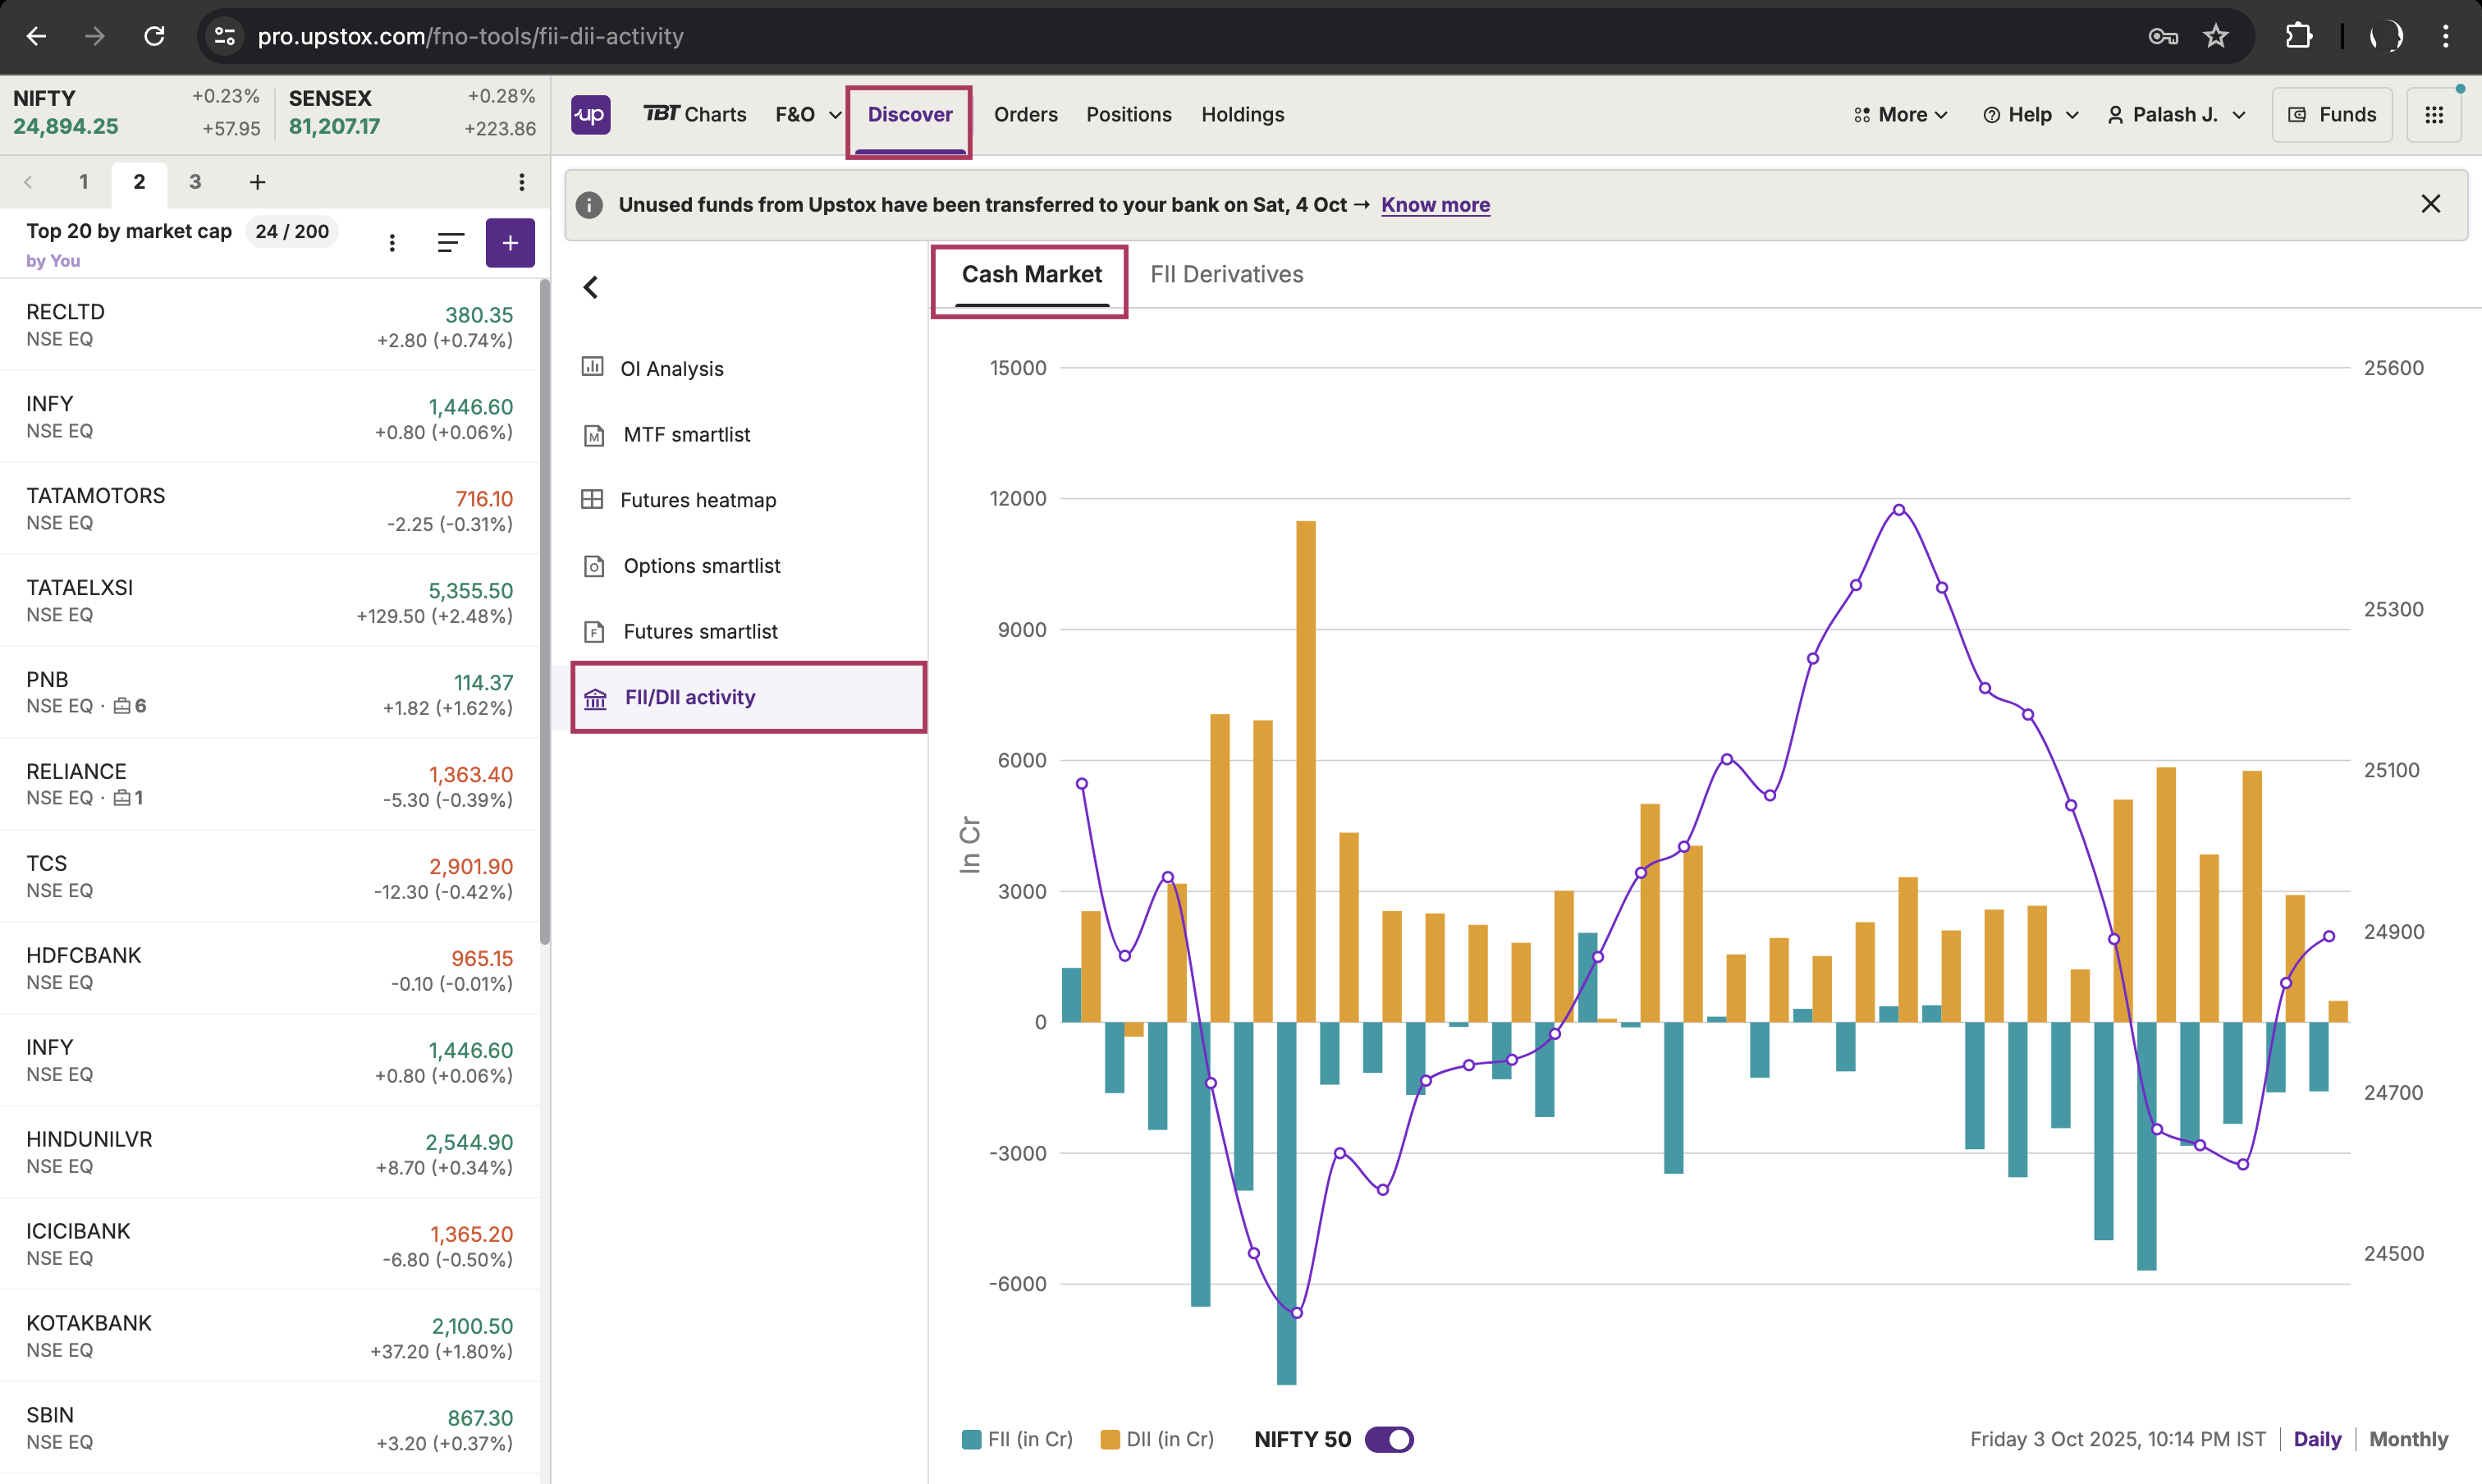
Where can you go & track live data?
To track this, you can use the Upstox app on Android, iOS, or access the web platform. It allows you to monitor both cash and derivatives market activity. A screenshot of the Web Pro platform is attached for reference.
Cash Market:
Derivatives market:

How Traders & Investors Can Use This Data:
Tracking FII-DII activity isn’t about predicting the market perfectly: it’s about understanding sentiment and liquidity flow. Here’s how you can interpret it:
-
For Traders
- Watch daily FII derivative positions - rising long positions = bullish momentum; rising shorts = caution.
- Combine FII data with India VIX - if FIIs are selling and VIX is rising, expect higher volatility.
- Use FII-DII data as a confirmation signal for technical setups - not the only driver.
-
For Long-Term Investors
- Sustained FII inflows indicate global confidence in India’s growth story.
- Consistent DII inflows show strong domestic participation - often a sign of underlying market strength.
- If FIIs sell but DIIs buy heavily, it can be a buy-the-dip opportunity for long-term investors.